Graph analysis
On this page
- Enable analysis
- Algorithms
- Analysis scope
- Selection requirements
- Clear highlights
- Returned dictionaries
- Using results
Enable analysis
These algorithms execute against the live Cytoscape graph in the browser. The
result is highlighted and returned to Streamlit as an analysis event.
Analysis scope
The default is the Displayed graph, excluding hidden records. With managed
expansion enabled, Loaded records runs the same Cytoscape algorithms in a
separate headless instance over cached nodes and edges, including collapsed
branches. Only displayed matches are highlighted; collapsed_result_ids reports
the remainder. Degree uses the same scope as paths and traversals; a self-loop
contributes two to total degree and one each to incoming and outgoing degree.
Source dataset is available only through an application provider supporting
analyze(request). Unsupported algorithms produce an explicit error. Nothing
silently substitutes the smaller displayed graph. See the
managed expansion guide and open the working
tutorial at /learn_expansion in the local examples app.
Algorithms
| Action | Question answered | Result fields |
|---|---|---|
shortest_path |
What is the shortest connection between two selected nodes? | source ID, target ID, distance, node IDs, edge IDs |
bfs |
What is reached breadth-first from one selected node? | root, visit order, node IDs, edge IDs |
dfs |
What is reached depth-first from one selected node? | root, visit order, node IDs, edge IDs |
connected_components |
Which disconnected groups exist? | component count and node-ID groups |
degree |
How connected is one selected node? | degree, indegree, outdegree, edge IDs |
Selection requirements
Shortest path requires exactly two selected nodes. BFS, DFS, and degree require one selected node. Connected components runs without a selection. Buttons are disabled when the current selection cannot satisfy the algorithm.
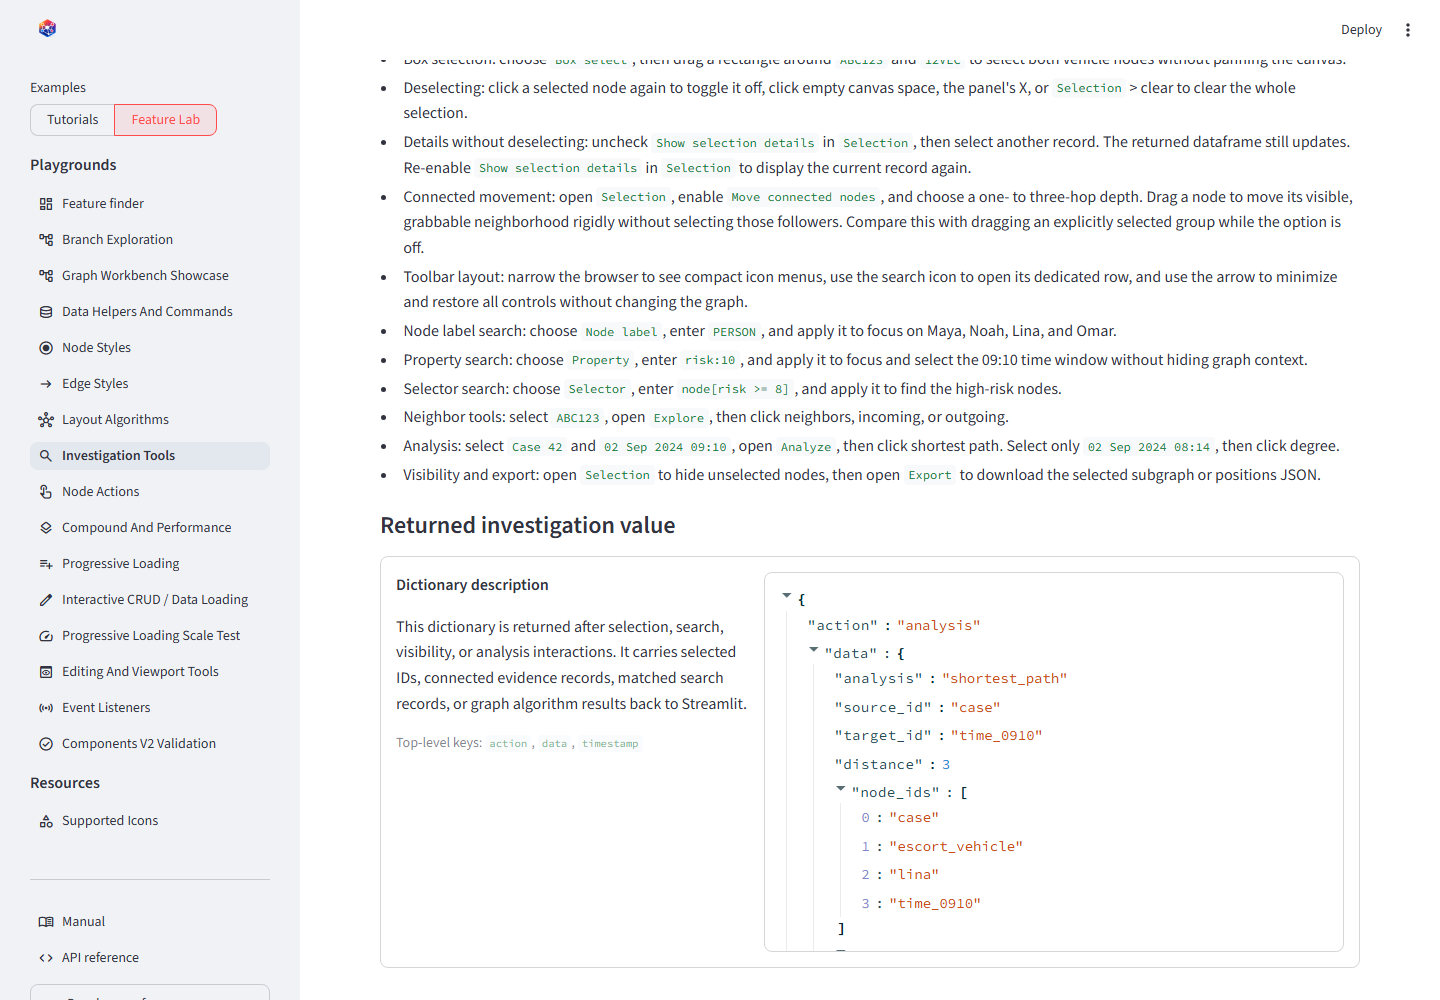
The highlighted result remains tied to an explicit dictionary returned to Python.
Clear highlights
Selection > Clear Selection and the details panel's X remove selected
records and analysis-result highlights from both nodes and edges. This does
not delete graph data, change the viewport, clear search matches, or erase an
analysis result already saved by Python. Ordinary deselection, such as clicking
blank canvas, leaves analysis highlighting available for inspection.
Source-provider results retain request_id: repeating the analysis deliberately
reapplies its highlights, even when its records and counts have not changed.
Returned dictionaries
{
  "action": "analysis",
  "data": {
    "analysis": "shortest_path",
    "source_id": "case-42",
    "target_id": "time-0910",
    "distance": 3,
    "scope": "visible",
    "source_dataset_id": "connected-records",
    "source_version": "2026-01",
    "view_revision": 4,
    "complete": true,
    "source_complete": false,
    "node_ids": ["case-42", "ABC123", "camera-7", "time-0910"],
    "edge_ids": ["case-vehicle", "vehicle-camera", "camera-time"]
  },
  "timestamp": 1780000000000
}
The IDs can retrieve authoritative records, generate an evidence table, create
a selected-subgraph export, or launch a server-side algorithm that applies
domain-specific weights and permissions.
complete describes the selected scope, not source coverage. source_complete
prevents interpreting a loaded subset as the entire dataset. Graph node_count
and edge_count describe the input scope; result IDs describe matches.
Using results
Browser algorithms are excellent for interactive exploration. They are not a replacement for audited server-side analytics where edge weights, access control, reproducibility, or very large graphs matter. Use the event as a request or starting set in those workflows.
Conclusion
Expose only algorithms relevant to the current task and explain the required selection. Always present the returned path or component records alongside the visual highlight when results influence a decision.