st-graph-workbench
st-graph-workbench is a general-purpose graph component for Streamlit,
powered by Cytoscape.js and integrated with Streamlit Components v2.
It helps you turn Python records into explorable
networks without building and maintaining a separate JavaScript application.
Users can search relationships, select records, expand connected data, run
graph analysis, edit structures, and return useful results to Python.
Why st-graph-workbench
Build interactive applications around connected data. Users can explore relationships, search and select nodes and edges, inspect records, run graph analysis, or request edits, while your Python application handles the results.
Use it for knowledge graphs, dependency maps, workflows, network topologies, or other connected datasets. You define what the nodes and relationships represent; the library provides reusable exploration, styling, analysis, editing, and event handling. Your application keeps control of its data and logic.
On this page
- What the library provides
- See it in action
- From records to results
- Choose a starting point
- Run the documentation and demos
- Responsibility model
- License
What the library provides
- Turn validated Python dictionaries and dataframes into interactive graphs.
- Find relevant records with text, label, property, and selector search.
- Select individual records or groups and receive analysis-ready dictionaries.
- Keep graph controls readable with an adaptive, compact, or minimized toolbar that can reserve space above the canvas.
- Rigidly move a bounded one-to-three-hop connected neighborhood without changing selection or record data.
- Reveal connections progressively through expansion and neighborhood tools.
- Trace shortest paths and inspect traversals, components, and node degree.
- Add application-owned CRUD workflows without surrendering data control.
- Choose from ten layouts, preserve positions, and control the viewport.
- Apply domain styling and familiar icons to make complex networks readable.
- Export graph data, positions, and images for downstream data workflows.
- Scale interaction using incremental commands and performance profiles.
- Load large result sets in cursor-aware batches without resetting the viewport.
Python remains responsible for source records, authorization, persistence, and business rules. The component supplies the interactive graph surface and sends structured user actions back to the application.
See it in action
The overview demonstrates search and graph analysis, independent expansion and collapse, Python-owned CRUD, browser-local editing, and bounded progressive loading. The examples use synthetic records, while the interaction patterns apply to any connected dataset.
Select two records, run shortest path, and use the returned IDs in Python. The highlighted route below contains five nodes and four edges; the separate connected group remains outside the result.
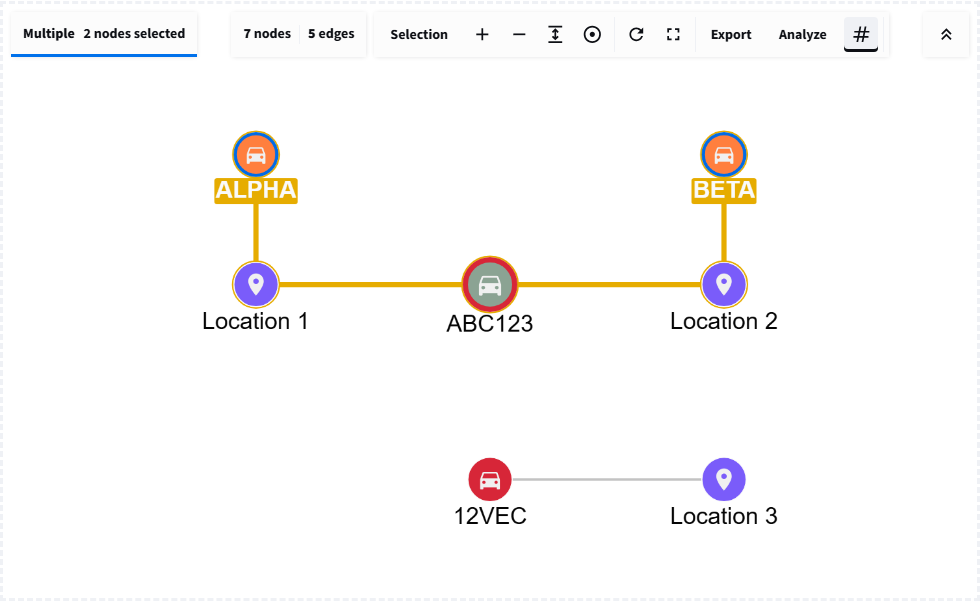
Real tutorial output: styled records, multiple selection, and a computed path. The returned dictionary connects the visual result to application data.
The in-action gallery shows searchable records, independent branch collapse with shared-record retention, and Python-owned CRUD dialogs. These are reusable interaction patterns for any connected dataset, illustrated here with fictional sample records.
Synthetic example data
All datasets and records used in the examples, documentation, and screenshots are synthetically generated. They do not describe real people, vehicles, locations, organizations, claims, or incidents.
From records to results
The following examples form one small Streamlit application. Fictional vehicle
observations are sample data, not a domain requirement: replace the records,
labels, and relationships with those from your own application. The examples
are also shown in the repository README and run directly in the local examples
app at /readme. The examples build on each other in order; run the combined
script with streamlit run app.py.
Create a graph from dictionaries
Use graph_workbench(...) with explicit node IDs and edge endpoints. This
example shows its source table first, then a vehicle connected to Harbour
camera 7. The edge retains the observation time as an inspectable property.
import streamlit as st

from st_graph_workbench import graph_workbench, records_to_dataframe

# Each node needs a unique ID; edges refer to those IDs.
elements = {
    "nodes": [
        {"data": {"id": "ABC123", "label": "VEHICLE", "name": "ABC123"}},
        {"data": {"id": "camera-7", "label": "LOCATION", "name": "Harbour camera 7"}},
    ],
    "edges": [
        {
            "data": {
                "id": "sighting-1",
                "source": "ABC123",
                "target": "camera-7",
                "label": "SEEN_AT",
                "observed_at": "2024-09-02 08:14",
            }
        }
    ],
}

# Inspect the source records before exploring the graph.
st.dataframe(records_to_dataframe(elements), hide_index=True)
event = graph_workbench(
    elements,
    layout="cose",
    selection_mode="multiple",
    return_selection=True,
    search=True,
    key="readme_quick_start_output",
    height=420,
)
The result is two nodes and one edge, with search and multiple selection.
event starts as None; interactions return an action, data, and timestamp.
The stable component key preserves its identity across Streamlit reruns.
Style nodes and edges
Use NodeStyle(...) for a node type's color, displayed property, icon, and
size, and EdgeStyle(...) for relationship styling. This reuses the same
records with a blue vehicle, green location, and directed SEEN_AT edge.
from st_graph_workbench import EdgeStyle, NodeStyle, graph_workbench

# Match the label in each node's data; display its name and a packaged icon.
node_styles = [
    NodeStyle("VEHICLE", "#2A629A", "name", "directions_car", size=40),
    NodeStyle("LOCATION", "#2D936C", "name", "place", size=40),
]
edge_styles = [
    EdgeStyle("SEEN_AT", "#2D936C", "label", directed=True),
]

# Reuse elements from the previous example with a separate component key.
event = graph_workbench(
    elements,
    layout="cose",
    node_styles=node_styles,
    edge_styles=edge_styles,
    selection_mode="multiple",
    return_selection=True,
    search=True,
    key="readme_styled_output",
    height=420,
)
Styles match the label in each record. Continue to
Styling and icons for conditional StyleRule(...)
selectors and the packaged icon catalog.
Prepare dataframes and graph records
Use records_to_dataframe(...) to turn named record groups into a table and
dataframe_to_records(...) to turn rows into JSON-friendly dictionaries.
These three sightings become two distinct vehicle nodes after deduplication.
from st_graph_workbench import dataframe_to_records, records_to_dataframe

# Named groups become a record_group column in the resulting dataframe.
sightings = {
    "sightings": [
        {"vehicle_id": "ABC123", "location": "Harbour camera 7", "time": "08:14"},
        {"vehicle_id": "ABC123", "location": "Depot gate", "time": "08:41"},
        {"vehicle_id": "12VEC", "location": "Depot gate", "time": "09:10"},
    ]
}
sightings_df = records_to_dataframe(sightings)

# Convert dataframe rows back into JSON-friendly dictionaries.
records = dataframe_to_records(sightings_df.drop(columns="record_group"))

# Decide which columns identify nodes; the helper does not infer relationships.
vehicle_df = sightings_df[["vehicle_id"]].drop_duplicates()
vehicle_df = vehicle_df.rename(columns={"vehicle_id": "id"})
vehicle_df["label"] = "VEHICLE"
vehicle_df["name"] = vehicle_df["id"]
vehicle_nodes = [{"data": row} for row in dataframe_to_records(vehicle_df)]
sightings_df has three rows; record_group records the original sightings
group. records holds the original row dictionaries and vehicle_nodes holds
two {"data": ...} node dictionaries. The helpers do not infer relationships:
your application chooses node IDs and edge endpoints. See the
intelligence workflow for a complete mapping.
Turn selections into useful results
A selection can drive a detail panel, evidence table, or database query. This code uses the styled graph's returned event and the source sightings.
import streamlit as st

from st_graph_workbench import records_to_dataframe

# Use the event from the styled graph and the source table above.
selection = event["data"] if event and event["action"] == "selection" else {}
selected_ids = selection.get("selected_node_ids", [])
selected_rows = records_to_dataframe(selection.get("selected_elements", []))

# Join graph IDs back to the source evidence, without changing that evidence.
matching_sightings = sightings_df[sightings_df["vehicle_id"].isin(selected_ids)]
st.metric("Matching sightings", len(matching_sightings))
st.dataframe(matching_sightings, hide_index=True)
Selecting ABC123 in the styled graph displays two sightings, at 08:14 and
08:41. No selected vehicle means an empty table and a zero count. Clearing
the selection clears the filtered result without changing the source data.
In the event dictionary, action="selection" identifies the interaction,
data.selected_node_ids provides IDs for filtering, and
data.selected_elements provides complete records for selected_rows.
Always check the action before reading its fields. The
selection guide explains the full payload.
Choose a starting point
- New user: follow Installation, then Quick start.
- Building graph data: read Graph elements and Tables and records.
- Building an interactive graph interface: use Selection and search, Expansion and visibility, and Graph analysis.
- Integrating persistent data: continue to CRUD and data loading and Graph commands.
- Looking up a function: use the API reference for a purpose summary, signature, accepted parameters, return type, and errors.
- Contributing to the implementation: continue to Frontend architecture and Development and packaging for the component lifecycle, source layout, tests, builds, and release checks.
Run the documentation and demos
The MkDocs site summarizes the library's benefits and workflows, then provides detailed API documentation for its public functions, parameters, return values, and errors. The Streamlit app lets readers try those capabilities on live graphs.
Run the documentation and examples as separate local applications. Select
unused ports for each service; the commands below use 8000 and 8502 as
examples:
# Terminal 1: searchable MkDocs guides and API details
uv sync --extra docs
uv run mkdocs serve -f mkdocs.local.yml --dev-addr 127.0.0.1:8000

# Terminal 2: interactive Streamlit examples
uv run streamlit run examples/app.py --server.port 8502
Open http://localhost:8000 for this manual and http://localhost:8502 for
the tutorial-first examples app. Start with a working graph, follow the
sixteen-lesson learning path, or switch to
Feature Lab for the comprehensive playgrounds. Neither command publishes anything.
Responsibility model
| Layer | Owns |
|---|---|
| Application Python | Data retrieval, authorization, persistence, dialogs, validation, and durable state |
st-graph-workbench Python |
Public API validation, styles, data helpers, commands, and component registration |
| Components v2 bridge | Props flowing to the browser and event dictionaries returning to Python |
| Cytoscape.js frontend | Rendering, hit testing, layouts, selection, graph algorithms, and viewport interaction |
This split is central to the library. A browser button can emit an intent, but your Python code decides whether and how durable application data changes.
License
Original work in st-graph-workbench is licensed under Apache License 2.0.
Third-party code and assets retain their respective licenses. Read the
license and attribution for the full terms and upstream notices.
Next step
Build the three-node vehicle observation in the quick start, then keep the local interactive examples app open beside this site.