st-graph-workbench in action
These screenshots show real interactions in the runnable tutorials, not interface mockups. The component combines graph exploration, structured Python events, algorithms, and editing in one surface. Your application chooses the data, vocabulary, permissions, and persistence rules.
On this page
- Compute a path and use its records
- Search records without discarding context
- Expand and collapse independent branches
- Validate changes before accepting them
- More workflows to try
- Conclusion
The fictional data contains vehicles, locations, observations, and reports. The same patterns apply to documents, dependencies, infrastructure, or any other connected records. Start the examples app before opening a local tutorial link below; screenshots remain viewable without running Streamlit.
Compute a path and use its records
The source contains seven nodes and five edges. ALPHA and BETA connect through Location 1, ABC123, and Location 2; 12VEC and Location 3 form a separate group. The user selects ALPHA and BETA, then runs Analyze > Shortest path.
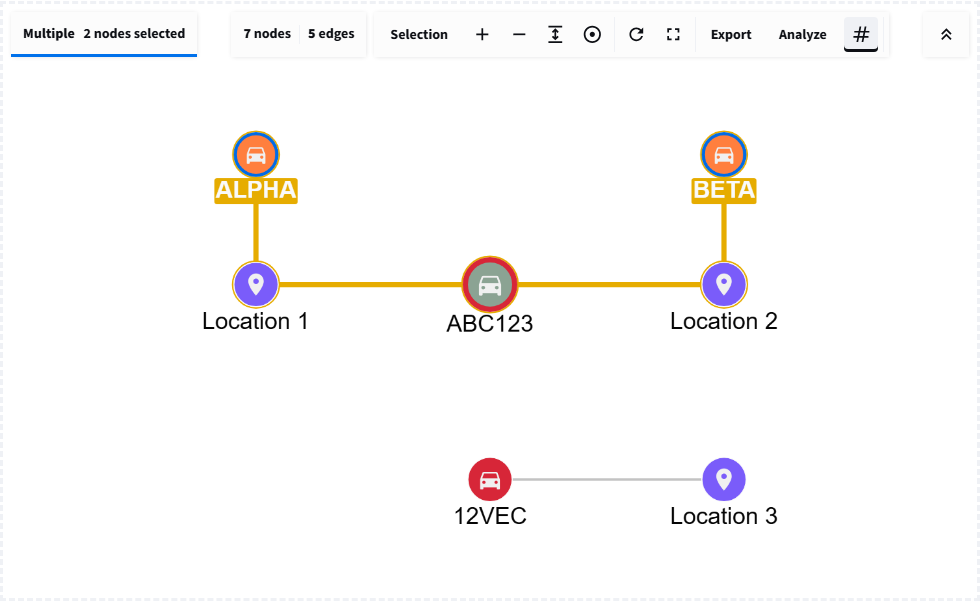
The actual shortest-path result contains five nodes and four edges. Type-specific icons and styles remain visible alongside analysis highlighting.
The returned analysis event includes data.distance=4, the result's node and
edge IDs, data.scope="visible", and the analyzed record counts. These IDs can
filter a dataframe, populate a report, or seed another query. Here, distance
means unweighted edge count, not travel time or physical distance.
Open Analyze relationships at /learn_analysis in the local examples app
for this path, BFS, DFS, connected components, and degree. The
analysis guide explains result fields and scope.
Search records without discarding context
On the same seven-node source, Node label search for PLACE returns three
locations. Text, edge label, property, and Cytoscape selector modes provide other
ways to choose a starting point.
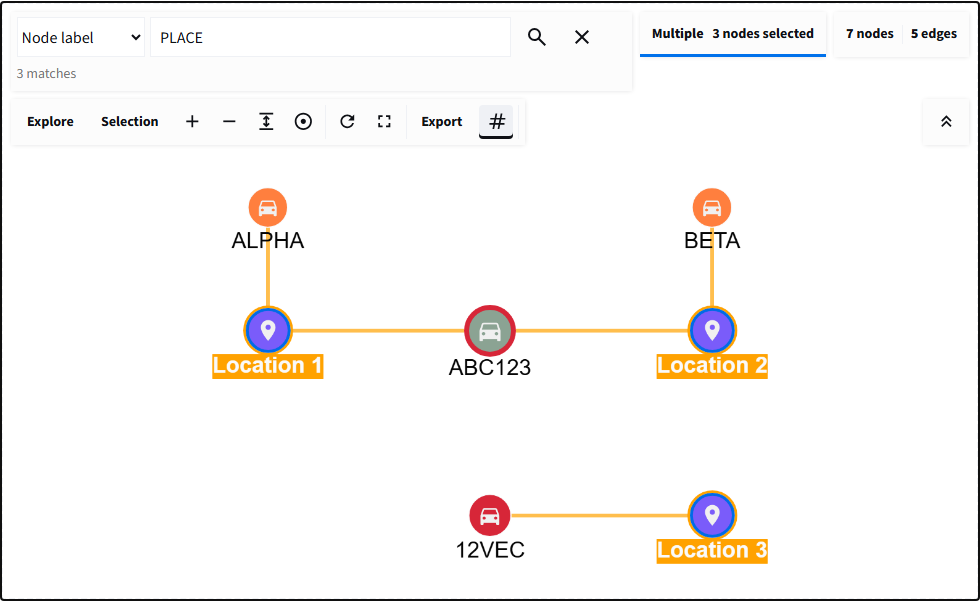
Three real search matches, with the camera reframed to show the surrounding records. Searching does not delete the other nodes or edges.
matched_node_ids identifies the matches and matched_elements carries their
properties back to Python. Selection details can be hidden while selected
records still drive Python-side tables. Neighborhood tools then reveal incoming
or outgoing context.
Open Find and reveal connections at /learn_search in the local examples
app and read Selection and search. Local search
is not a database query; source search requires a capable expansion provider.
Expand and collapse independent branches
The source has twelve nodes and thirteen edges. Starting at ABC123, expand both locations and load their remaining pages. Eight nodes are now displayed; Location 1 and Location 2 both contribute the Shared report.
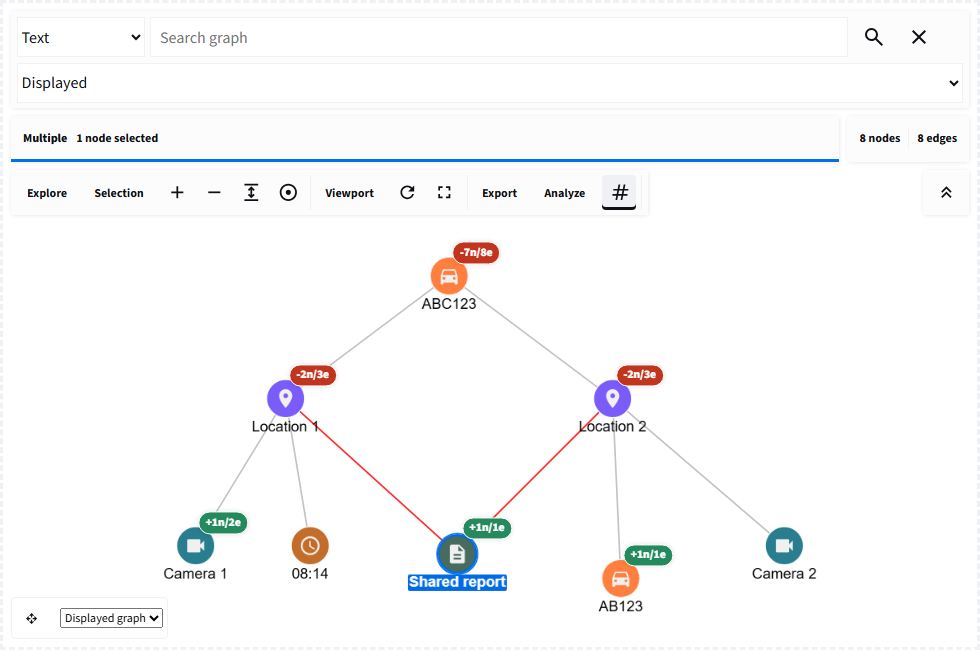
Before collapse: eight nodes and eight edges. The shared report is selected; its details panel is hidden using the Selection menu.
Now right-click Location 1 and choose Collapse connections.
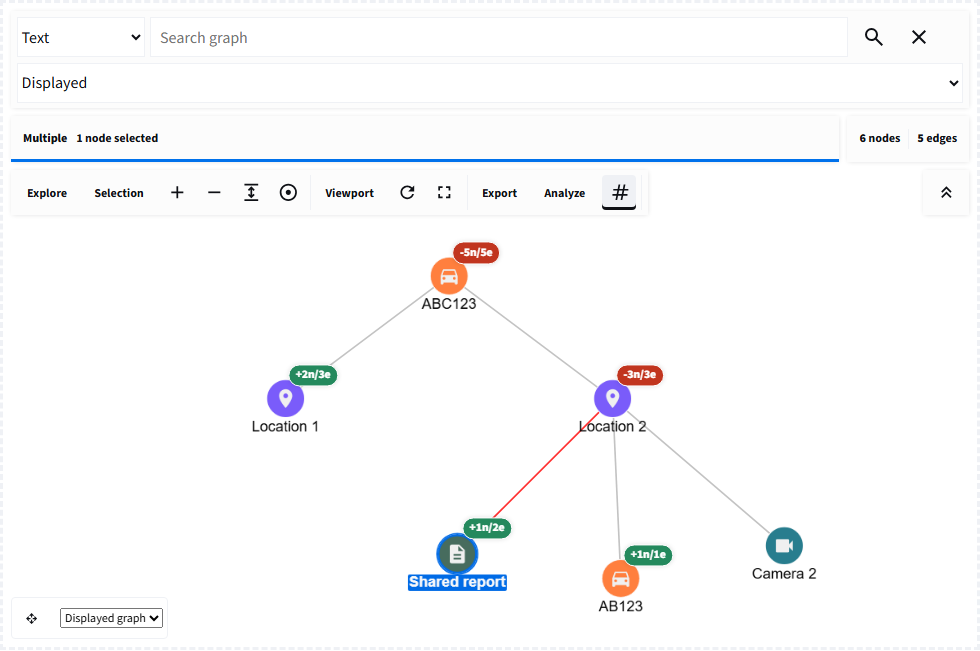
After collapse, at the same camera position: six nodes and five edges. Camera 1 and 08:14 are hidden. The Shared report remains because Location 2 still needs it.
This is reversible visibility, not recursive deletion. Cached records and positions remain available for reopening. The badge counts unique hidden nodes and edges separately. Source, loaded, and displayed scopes are deliberately different; collapsing a branch does not mean its source records ceased to exist.
Open Expand progressively at /learn_expansion or Branch exploration at
/branch_expansion in the local examples app. The
expansion guide covers filters, protected
records, bulk limits, cancellation/retry, scoped analysis, and snapshots.
Validate changes before accepting them
The CRUD lesson starts from the seven-node checkpoint. Create node requests an operation but does not modify the graph until Python accepts it.
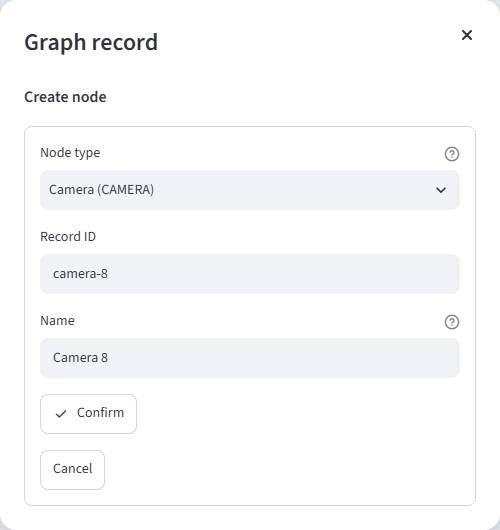
The real Streamlit form, filled in before submission. Its type list and validation rules belong to the application.
Confirm checks the ID and prepares an incremental command, updating both the Python checkpoint and browser graph. Cancel leaves both unchanged. An application can add authorization and durable database persistence at this boundary; the sample uses session state, not a production database.
Use Build CRUD workflows at /learn_crud when validation must precede a
change. Use Edit in the browser at /learn_editing for draft-first
interactions with undo/redo and later reconciliation. Read
CRUD and editing for the
ownership distinction.
More workflows to try
- Ten layouts and viewport controls: choose an arrangement, retain positions, or restore a saved camera.
- Incremental commands: update an existing graph and track acknowledgments without replacing the entire canvas.
- Progressive loading: fetch batches with progress, completion, retry, and reset handling.
- Exports and positions: reuse full, visible, or selected data and export graph images.
- Compound graphs and performance: organize parent/child structures and choose settings for larger graphs.
Conclusion
The visual graph is the starting point, not the final output. Use selections, search results, analysis IDs, and editing intents as inputs to your Python workflow. Follow the tutorial path to build each interaction.