Quick start
On this page
The source data
This first graph connects vehicle ABC123 to a harbour camera and an
observation time. Every node has an id, label, and display name; every
edge identifies its source and target node IDs.
| Record | ID | Type or relationship | Connected IDs |
|---|---|---|---|
| Node | ABC123 |
VEHICLE |
|
| Node | camera-7 |
LOCATION |
|
| Node | time-0814 |
TIME |
|
| Edge | ABC123-camera-7 |
SEEN_AT |
ABC123 to camera-7 |
| Edge | camera-7-time-0814 |
OBSERVED_DURING |
camera-7 to time-0814 |
Complete application
Create a Streamlit file with this code and run it with streamlit run:
import streamlit as st

from st_graph_workbench import EdgeStyle, NodeStyle, graph_workbench

st.set_page_config(layout="wide")

elements = {
    "nodes": [
        {"data": {"id": "ABC123", "label": "VEHICLE", "name": "ABC123"}},
        {
            "data": {
                "id": "camera-7",
                "label": "LOCATION",
                "name": "Harbour camera 7",
            }
        },
        {
            "data": {
                "id": "time-0814",
                "label": "TIME",
                "name": "02 Sep 2024 08:14",
            }
        },
    ],
    "edges": [
        {
            "data": {
                "id": "ABC123-camera-7",
                "label": "SEEN_AT",
                "source": "ABC123",
                "target": "camera-7",
            }
        },
        {
            "data": {
                "id": "camera-7-time-0814",
                "label": "OBSERVED_DURING",
                "source": "camera-7",
                "target": "time-0814",
            }
        },
    ],
}

event = graph_workbench(
    elements,
    layout="cose",
    node_styles=[
        NodeStyle("VEHICLE", "#2A629A", "name", "directions_car"),
        NodeStyle("LOCATION", "#2D936C", "name", "place"),
        NodeStyle("TIME", "#8A5A44", "name", "schedule"),
    ],
    edge_styles=[
        EdgeStyle("SEEN_AT", "#2D936C", "label", directed=True),
        EdgeStyle("OBSERVED_DURING", "#8A5A44", "label", directed=True),
    ],
    selection_mode="multiple",
    return_selection=True,
    search=True,
    height=560,
    key="quickstart-graph",
)

st.subheader("Returned component event")
st.caption(
    "The browser returns this dictionary after a selection or search interaction."
)
st.json(event or {})
The stable key identifies this graph across Streamlit reruns. The node and
edge style helpers turn business labels into Cytoscape selectors and visual
properties.
Expected graph
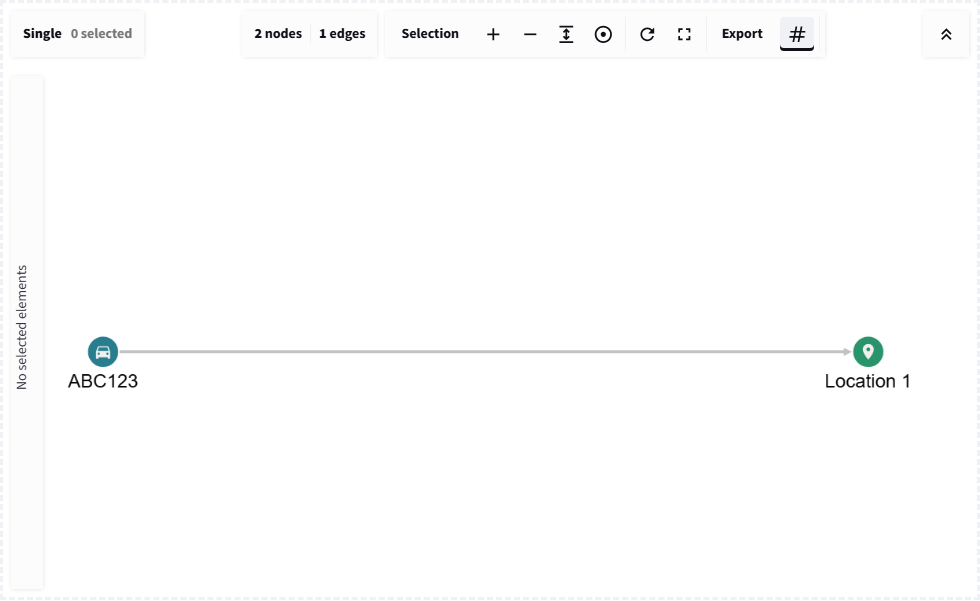
The quick-start graph and its returned event area in the Streamlit examples app.
Returned dictionary
After selecting the vehicle, graph_workbench() returns a dictionary similar
to this one:
{
  "action": "selection",
  "data": {
    "selected_node_ids": ["ABC123"],
    "selected_edge_ids": [],
    "connected_node_ids": ["camera-7"],
    "connected_edge_ids": ["ABC123-camera-7"],
    "last_selected": {
      "group": "node",
      "data": {
        "id": "ABC123",
        "label": "VEHICLE",
        "name": "ABC123"
      }
    },
    "selected_elements": [
      {
        "group": "node",
        "data": {
          "id": "ABC123",
          "label": "VEHICLE",
          "name": "ABC123"
        }
      }
    ]
  },
  "timestamp": 1780000000000
}
action identifies the interaction family. The nested data dictionary
contains compact ID lists for queries and complete element records for tables,
exports, or application logic. timestamp distinguishes a new interaction
from the value retained across a Streamlit rerun.
What to try
- Select the vehicle and inspect
selected_node_ids. - Search for
08:14and inspect the matched element records. - Change
layout="cose"tolayout="circle". - Convert the returned records to a dataframe with
records_to_dataframe(event["data"]["selected_elements"]).
Conclusion
The graph is a view over Python-owned records. Continue with How it works before adding persistent editing or expansion.